My name is Susan Kistler. I am the American Evaluation Association’s Executive Director and aea365’s regularly Saturday contributor. Back in September, I wrote about the emergence of huge, free, online courses – some of them taught by leading-edge thinkers in a particular field. I noted that I’d need to wait until winter to enroll in one, given AEA’s schedule and upcoming conference. Well, I saw a snowflake yesterday, I’m wrapping holiday gifts, and we’ve dug the hats and scarves out of the attic. Winter’s here and I’m ready for a bit of professional invigoration!
Rad Resource – Subscribe to Evaluspheric Perceptions: AEA Member Sheila Robinson has started her own blog, focusing on “Reflections of an everyday evaluator/learner/educator exploring the evalusphere.” She’ll be telling us more about her blog during this winter’s installation of the aea365 bloggers series, but suffice it to say that she brings a unique voice, an on the ground perspective, and an evaluative lens to her writing. And…it was her blog that alerted me to a course being offered this winter that I just can’t pass up.
Hot Tip – Enroll in the Free Knight Center’s Introduction to Infographics and Data Visualization: The course is online, and free, and will be offered between January 12 and February 23. According to the course information, we’ll learn the basics of:
“How to analyze and critique infographics and visualizations in newspapers, books, TV, etc., and how to propose alternatives that would improve them.
How to plan for data-based storytelling through charts, maps, and diagrams.
How to design infographics and visualizations that are not just attractive but, above all, informative, deep, and accurate.
The rules of graphic design and of interaction design, applied to infographics and visualizations.
Optional: How to use Adobe Illustrator to create infographics.”
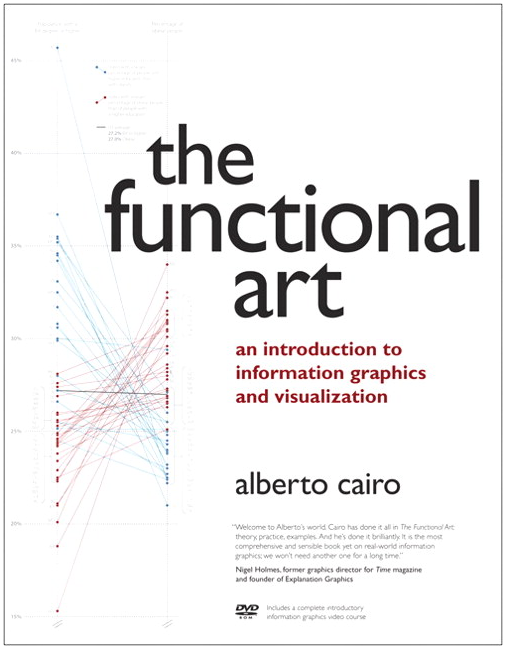
 Rad Resource – The Functional Art: An Introduction to Information Graphics and Visualization: The course is being taught by Alberto Cairo, author of The Functional Art. You don’t need to buy the book to take the course (you’ll be given free access to select chapters), but my copy arrived earlier this week. It is a mix of theory, practice, and research and appears to offer a solid grounding in both the art and science behind data visualization.
Hot Tip – Win a Free Copy! We haven’t had a book drawing in a while on aea365. Share your favorite resource or tip for improving data visualization via the comments (just click on the session title if you are receiving this via email to get back to the website). We’ll draw a name at random from among the comments posted on or before Friday, December 14, and the winner will receive a free copy of The Functional Art. Anyone is welcome to enter, but only one entry per person please!
The above represents my own opinions, and not necessarily that of AEA. Do you have questions, concerns, kudos, or content to extend this aea365 contribution? Please add them in the comments section for this post on the aea365 webpage so that we may enrich our community of practice. aea365 is sponsored by the American Evaluation Association and provides a Tip-a-Day by and for evaluators.


